What’s the best way to offer quick and intuitive explanations of complex research results to audiences of scientists, economic experts and public policymakers? The communications team at EBP has the answer: by creating smart, intuitive and well-designed infographics that both supplement and interactively structure the source research reports.

Project background: highly resource-efficient wastewater treatment plants (WTPs) can make a contribution to a greener economy and more sustainable energy supply system in Switzerland. EBP examined various technical means of increasing the resource efficiency of power consumption models, heat-recovery systems, energy production facilities and methods of both nitrogen and phosphorus recovery.
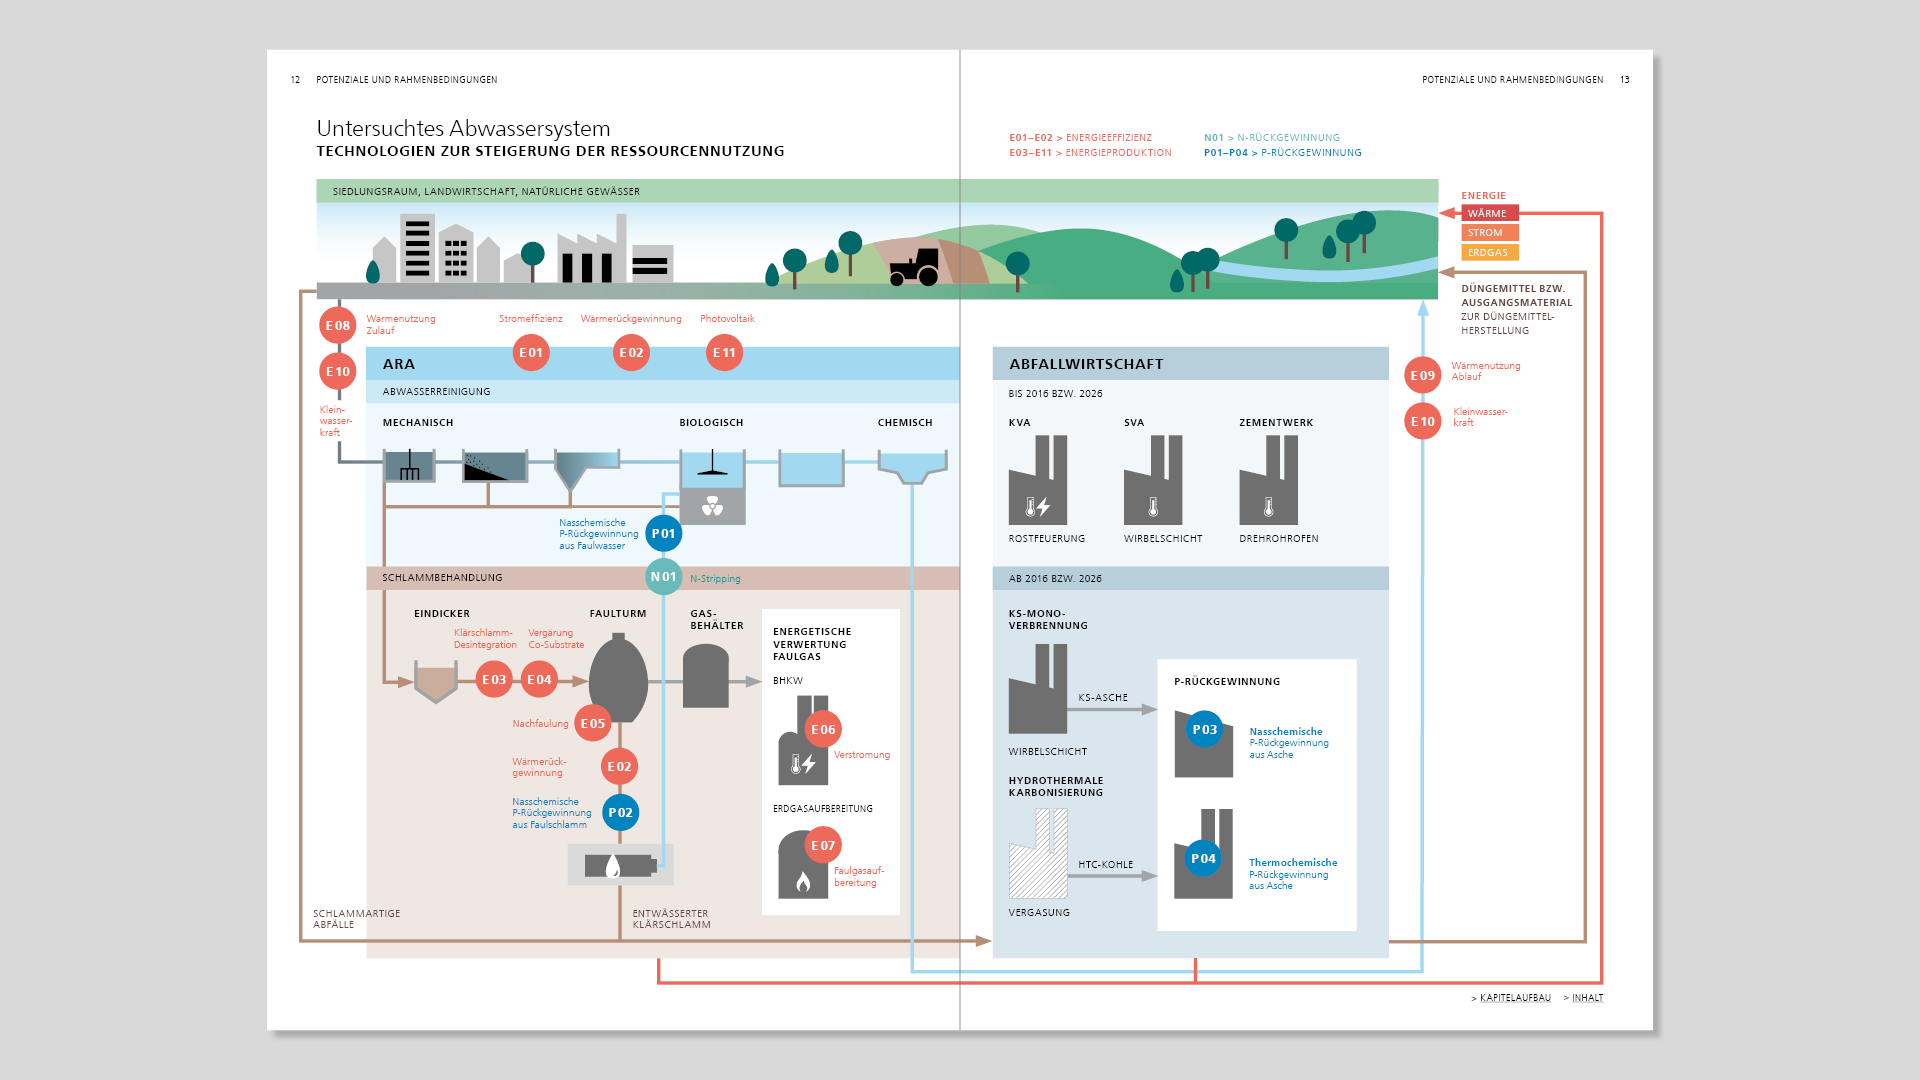
The results were documented in the form of a final report. In order to communicate these results in an intuitive and well-structured manner to an audience of scientists, economic experts and public policymakers, an emphasis was placed on the structure of the report. The EBP communications team developed a synoptic infographic as a key to unlocking the report. The infographic offers an overview of the WTP infrastructure, presents all of the examined technologies at a glance and links these technologies to corresponding fact sheets that offer readers a more detailed, but also visually strong overview of the individual measures. Additional orientation is provided by intuitive icons and a carefully thought-out color concept. This enables readers to gain a quick grasp of even very complex issues while also making the publication easy to work with.
The report was developed in the framework of the Resource-Efficient Wastewater Treatment Plants project.